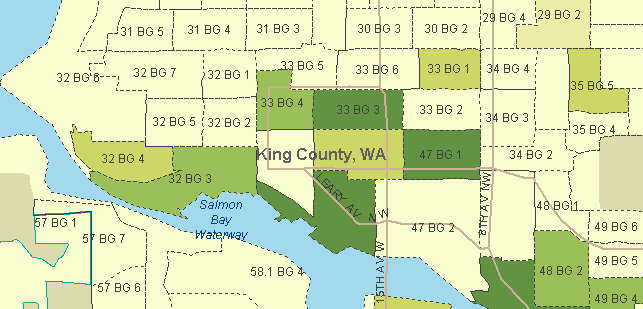
The white areas are where the African-American population is 0 percent. Shaded areas show African-American populations between 1-2 percent in the lightly shaded areas and from 3 to less than 50 percent in the green areas.
Remapping Debate, an online domestic public policy journal, recently released a mapping tool which shows racial diversity.
Using data from the American Community Survey collected between 2005 and 2009 and released in December of last year, Remapping Debate and Social Explorer created a map that shows racial diversity within Census Block Groups. One can zoom in to one's own neighborhood or any other U.S. neighborhood of interest.
The Census Blocks Groups represent smaller geographic areas than do Census Tracts and Remapping Debate has found that segregation is still an issue. 75 percent of African-Americans live in only 16 percent of the Census Block Groups, while 30 percent of African-Americans live in Census Block Groups that are 75 percent African-American.
Their mapping reveals high levels of segregation that are cloaked at larger geographic levels. Ballard is one of those areas.
While Seattle as a whole may appear to be a patchwork of different diversity densities, Ballard itself shows a lot of white - Census Block Groups that have 0 blacks.
Considering Ballard's Nordic heritage, this may come as no surprise to some.
The mapping tools also has the options to map the hispanic population in the area, which in Ballard is more diverse than the black population.
Thanks to former BNT report Michael Harthorne (now at KOMO news) for being the first to find out about this informative tool.