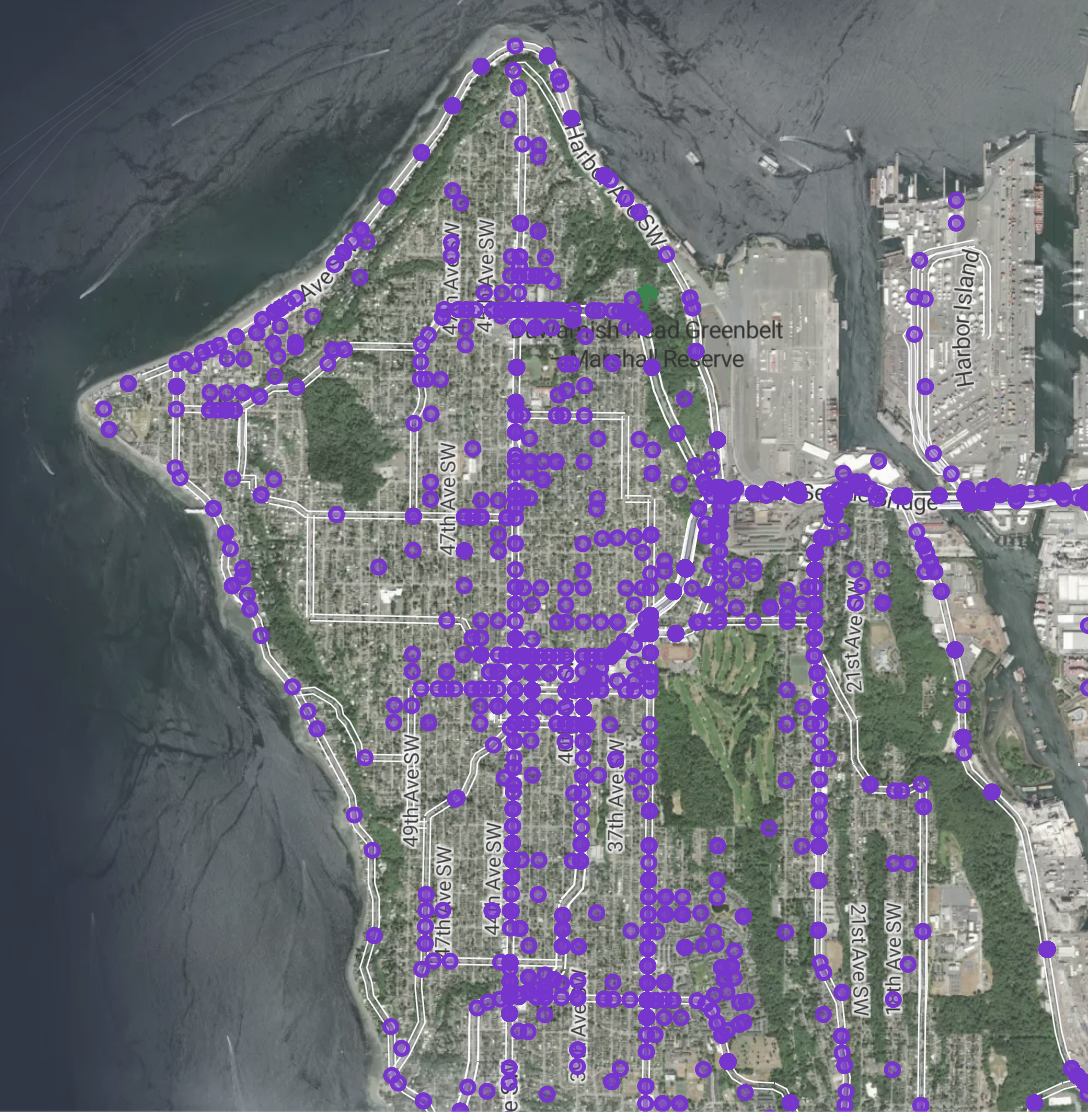
The Seattle Department of Transportation has made public an interactive traffic crash, volume and intersection analysis tool. Users can define areas they want more information about using on site tools.
The Seattle Department of Transportation (SDOT) is unveiling a new public-facing data dashboard with interactive maps to more easily find information used in our citywide transportation plan and in our Vision Zero safety work.
The tool shows that from June 20, 2022 to June 19, 2025 there were 19,227 crashes in the City of Seattle, with 7822 injuries and 87 fatalities. Users can drill down (presumably though in our test the tool was not working properly) into specific areas you can specify for data.
SEE A TUTORIAL VIDEO BELOW
In SDOT's press release they say:
With this new user-friendly tool, SDOT hopes to improve transparency and empower the community to track progress, hold us accountable, and contribute to meaningful safety improvements citywide.
Who does this benefit? Everyone. Researchers, journalists, lawyers, and curious citizens are invited to explore our data sets, dating as far back as 2000, to help us gain new insights and build a better future.
The dashboard includes:
While data is added on an ongoing basis, please allow up to a year for all available data to populate in the dashboards.
Additional resources: